Orthology Benchmarking Service Documentation
The Orthology Benchmarking Service is an automated web-based service to facilitate orthology benchmarking, established and maintained by the Quest for Orthologs community.
Users of the orthology benchmarking web service can take advantage of two main functionalities, accessible from the landing page:
- Viewing publicly available results: “Consumers” of orthology predictions can compare the performance of state-of-the-art methods and resources, and identify a resource suitable for their needs.
- Testing your own method: “Producers” of orthology predictions can test their own method by uploading ortholog pairs, and testing them on a variety of benchmarks in the context of other state-of-the-art tools.
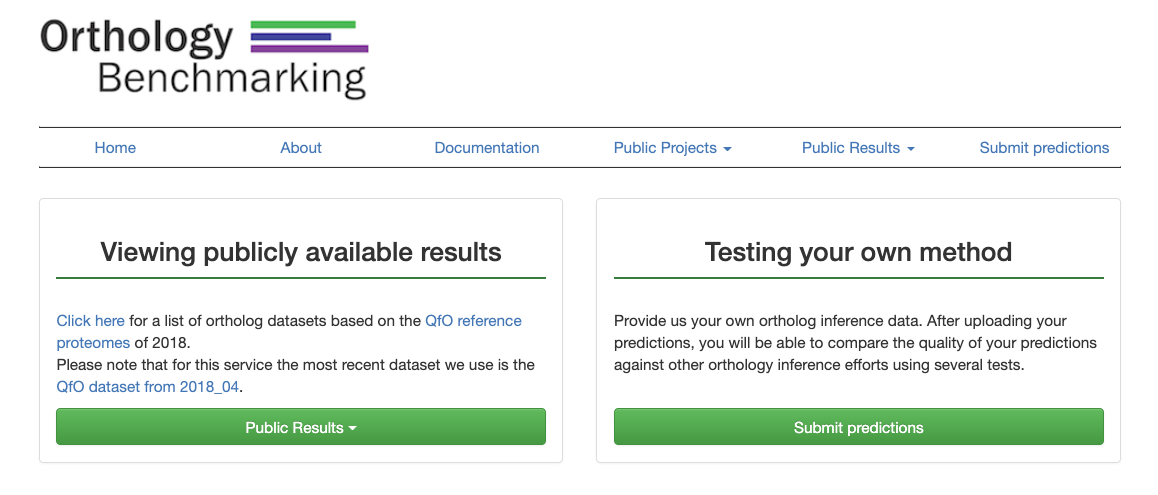
Comparing state-of-the-art methods
Several well-established orthology tools have run their methods on a Reference Proteome Set and have already been benchmarked. Their results are publicly available online for comparison. On the homepage (depicted in Figure 1), click on “Public Results” and select which Reference Proteome Set to view from the drop down menu.
On this page, the publicly-available benchmarking results are displayed, organized by type of benchmark.
- Phylogeny-Based Benchmarks are based on the assumption that two genes are orthologs if they diverged through a speciation event. Therefore, the phylogenetic tree of a set of orthologs has by definition the same topology as the corresponding species tree. For these phylogenetic-based tests, we sample putative orthologous genes, make a gene tree, and measure how congruent the resulting tree is with the species tree.
- Function-Based Benchmarks are based on the assumption that orthologs tend to retain their function (also known as the ortholog conjecture). For these benchmarks, we test the agreement between gene ontology (GO) annotations or enzyme classification (EC) numbers.
More details about each of the benchmarks are described in paper Standardized benchmarking in the quest for orthologs
Select a Benchmark from one of the two categories. For the Species Tree Discordance and Generalized Species Tree Discordance Benchmarks, it is necessary to choose a taxonomic group (displayed as tabs below).
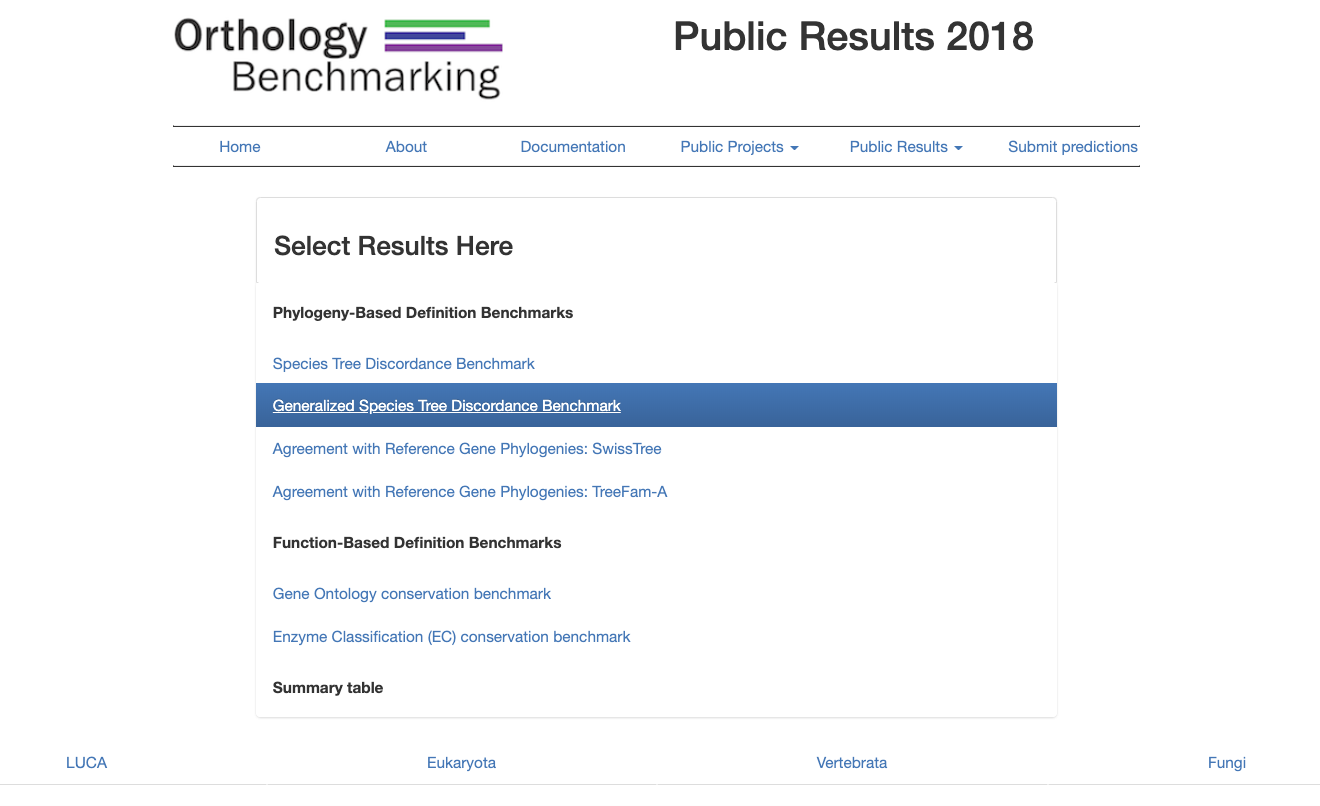
In the Generalized Species Tree Discordance Benchmark example, clicking on the Vertebrate tab displays a plot showing the publicly-available results of the benchmark.
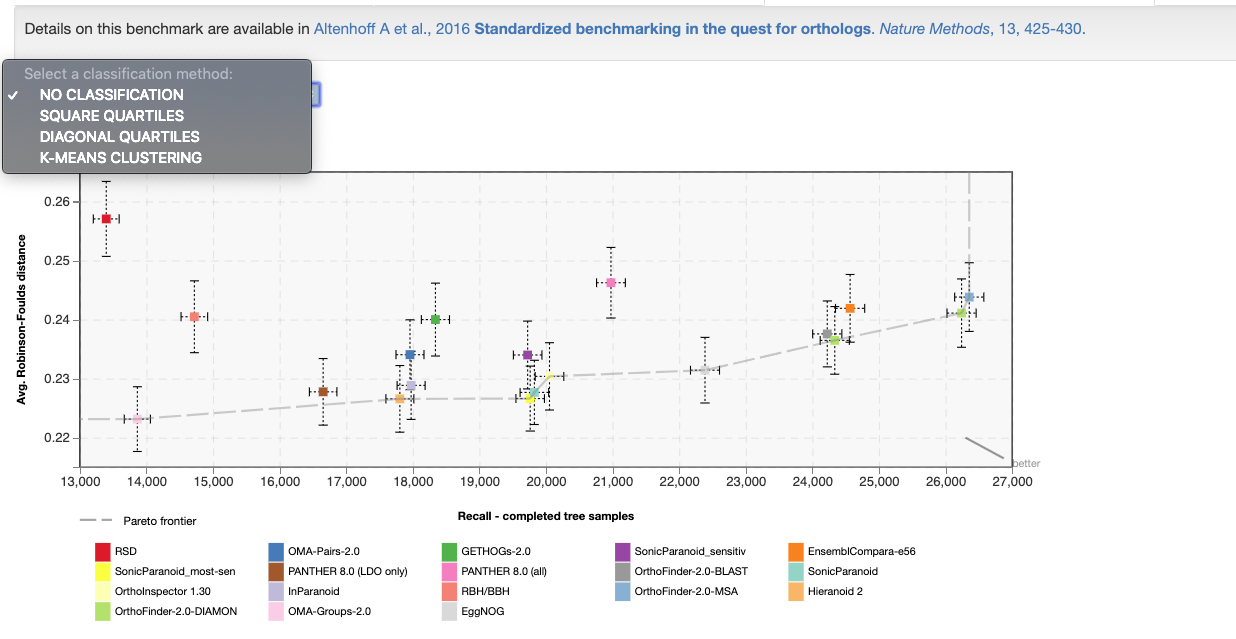
In all benchmarking result plots, the Precision versus Recall curve is shown. The exact measures depend on the benchmark. For several benchmarks there exists more than one measure per axis, in which case they can be selected with a drop-down menu above the plot showing the result. The different measures are described in the next section. An arrow is displayed which points to the better predictions. The Pareto frontier is shown as a dashed line. Additionally, one can classify the results based on square quartiles, diagonal quartiles, or K-means clustering.
Measures of the benchmarks
Orthology is a property for which it is very difficult to establish a ground truth dataset. We therefore use surrogate measures to assess the quality of predictions.
To assess the recall, we use three different measures in the benchmarks.
- Number of orthologs: We simply count the number of predicted orthologs in a given set of proteins. This measure is used in the species tree discordance benchmarks and in the function-based benchmarks.
- Number of completed tree samples (out of 50k trials): This measure is used only in the species tree discordance benchmarks. It uses as surrogate for recall the number of successful samplings of orthologs on a subtree of the species tree (out of 50k trials).
- TPR (True positive rate): This measure is used in the benchmarks where the implied orthologs of reference gene trees are compared to predicted orthologs. In these benchmark we assume that the reference gene trees are correct and complete. In this case, we can use the true positive rate as a common measure for recall. It is defined as the (number of correctly predicted orthologs) / (number of true orthologs).
- Avg Robinson-Folds distance: This measure is used in the species tree discordance benchmarks. It uses the average of the normalized Robinson-Foulds distances between the inferred gene tree of the predicted orthologs and the species tree. The details about how the gene trees are inferred are descibed in doi.org/10.1038/nmeth.3830.
- Fraction of incorrect trees: This measure simply checks if the inferred gene tree from the predicted orthologs and the expected species tree.
- PPV - Positive predictive value: This measure is used in the benchmarks where the implied orthologs of reference gene trees are compared to predicted orthologs. In these benchmark we assume that the reference gene trees are correct and complete. In this case, we can use the positive predictive value as a common measure for precision. It is defined as the (number of correctly predicted orthologs) / (number of predicted orthologs).
- Average Schlicker similarity: The average Schlicker similarity measure is a information content based similarity measure based on Lin similarity and can be used compare hierarchical annotations (such as Gene Ontology annotations or EC numbers). The Schlicker extension allows to also compare genes with more than one annotation to each other.
Classifications of the benchmark results
The user can optionally activate one of the classification overlays on the result plots. There are the following 3 different classification algorithms implemented:
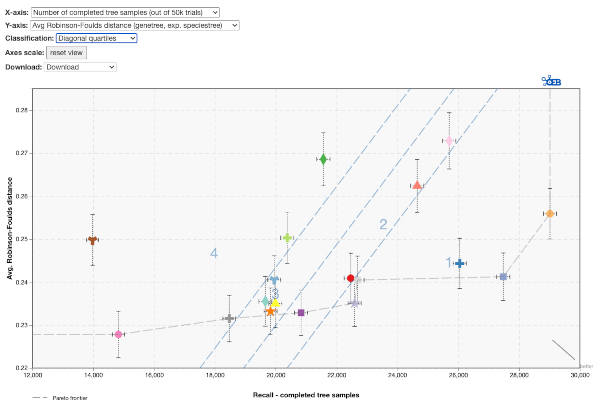
- Square quartiles: divides the space in 4 rectangles by getting the two median values of the X and Y metric.
- Diagonal quartiles: divides the plotting area with diagonal lines by scoring each participant based on their distance to the ‘optimal performance.’ After normalizing the axes to the 0-1 range, the score is the sum of each point's distances to the axes. A higher score indicates closer proximity to ideal performance. Linear quartiles classification is then applied to the scores, grouping participants into four classes with roughly equal numbers. Groups are rated based on performance: those with the highest scores are considered the first quartile (best).
- K-means clustering: group the results using the K-means clustering algorithm, which separates samples into 4 groups of equal variance by minimizing the within-cluster sum-of-squares. After convergence, the groups are sorted in the following way: The cluster's centroid are scored similarly to the diagonal quartiles method and then ranked accordingly.
Benchmarking one own's methods
This function is for users who wish to run all the standard benchmarks on their own orthology inferences. One key point is that to avoid mapping issues and biases due to differences in input data, orthology inferences must be made on one of the Quest for Orthologs reference proteome sets. In that way, the results will be directly comparable to other publicly-available methods.
Overview of the workflow
The overall workflow for using the benchmark service is as follows:
- An orthology method developer first infers orthologs using the Quest for Orthologs (QfO) reference proteome data set.
- Results are uploaded to the Benchmarking service, benchmarks are selected, and they are run in parallel using ELIXIR’s OpenEBench platform.
- The method's performance is evaluated by statistical analyses and comparison to publicly available datasets.
Reference proteomes
In order to compare different orthology prediction methods, a common set of protein sequences must be used. For this purpose, the QfO community, in collaboration with the EBI, has established the Reference Proteome set of proteomes. These proteomes have been selected to cover well-studied model organisms and other organisms of interest for biomedical research and phylogeny.
The reference proteomes are released yearly, in April. The best practice for new methods is to run on the reference proteome dataset of the previous year. For instance, in June 2020, a user will typically perform their analyses on the 2019 dataset. In that way, there will already be some points of comparisons. Established methods are encouraged to submit predictions on the latest dataset.
Reference proteomes for various years are available here.
Submitting ortholog predictions
First, prepare your ortholog predictions to upload in one of the acceptable file formats. Our benchmarks currently assess orthology on the basis of protein pairs. Therefore, we ask our users to upload their prediction in a format from which we can extract pairwise relations in an unambiguous manner. We support:
- Recommended: OrthoXML v0.3, which allows for nested orthologGroups and paralogGroups. In the future, new group-wise benchmarks will only be available for submissions in this format
- Simple text file with two tab-separated columns of orthologous protein represented by their ids
For both formats, we expect you to submit your predictions in a single file. This file might also be compressed by gzip or bzip2. In that case, it needs to have the proper filename extension (.gz or .bz2).
Assume your method produces the following gene history for the insulin family:
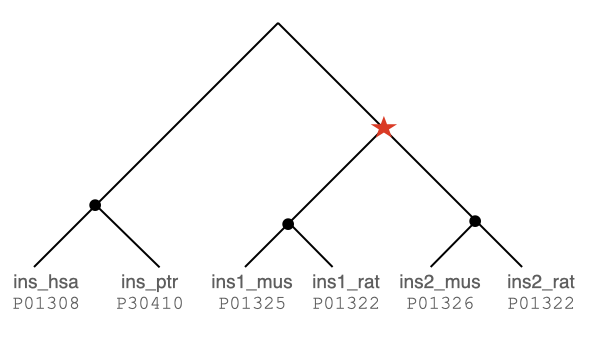
You can now either extract all the pairwise orthologous relations from the tree or encode the reconciled tree in an orthoxml format. You have to do this for all the gene families in a single file.
If you submit a tab-seperate file, your file should look like this:
P01308	P30410
P01308	P01325
P01308	P01326
P01308	P01322
P01308	P01323
P30410	P01325
P30410	P01326
P30410	P01322
P30410	P01323
P01325	P01322
P01326	P01323
If you submit a orthoxml formatted file, use the primary accession in the gene's protId attribute:
<orthoXML xmlns="http://orthoXML.org/2011/" version="0.3" origin="orthoXML.org" originVersion="1">
  <species name="Homo sapiens" NCBITaxId="9606">
    <database name="UP000005640" version="QfO-2020">
      <genes>
        <gene id="1" protId="P01308" />
      </genes>
    </database>
  </species>
  <species name="Pan troglodytes" NCBITaxId="9598">
    <database name="UP000002277" version="QfO-2020">
      <genes>
        <gene id="2" protId="P30410"/>
      </genes>
    </database>
  </species>
  <species name="Mus musculus" NCBITaxId="10090">
    <database name="UP000000589" version="QfO-2020">
      <genes>
        <gene id="3" protId="P01325"/>
        <gene id="4" protId="P01326"/>
      </genes>
    </database>
  </species>
  <species name="Rattus norvegicus" NCBITaxId="10116">
    <database name="UP000002494" version="QfO-2020">
      <genes>
        <gene id="5" protId="P01322"/>
        <gene id="6" protId="P01323"/>
      </genes>
    </database>
  </species>
  <groups>
    <orthologGroup id="Insulin">
      <orthologGroup>
        <geneRef id="1" />
        <geneRef id="2" />
      </orthologGroup>
      <paralogGroup>
        <orthologGroup>
          <geneRef id="3" />
          <geneRef id="5" />
        </orthologGroup>
        <orthologGroup>
          <geneRef id="4" />
          <geneRef id="6" />
        </orthologGroup>
      </paralogGroup>
    </orthologGroup>
  </groups>
</orthoXML>
Next, from the homepage, click on Submit Predictions. This redirects to the QfO page on OpenEBench:
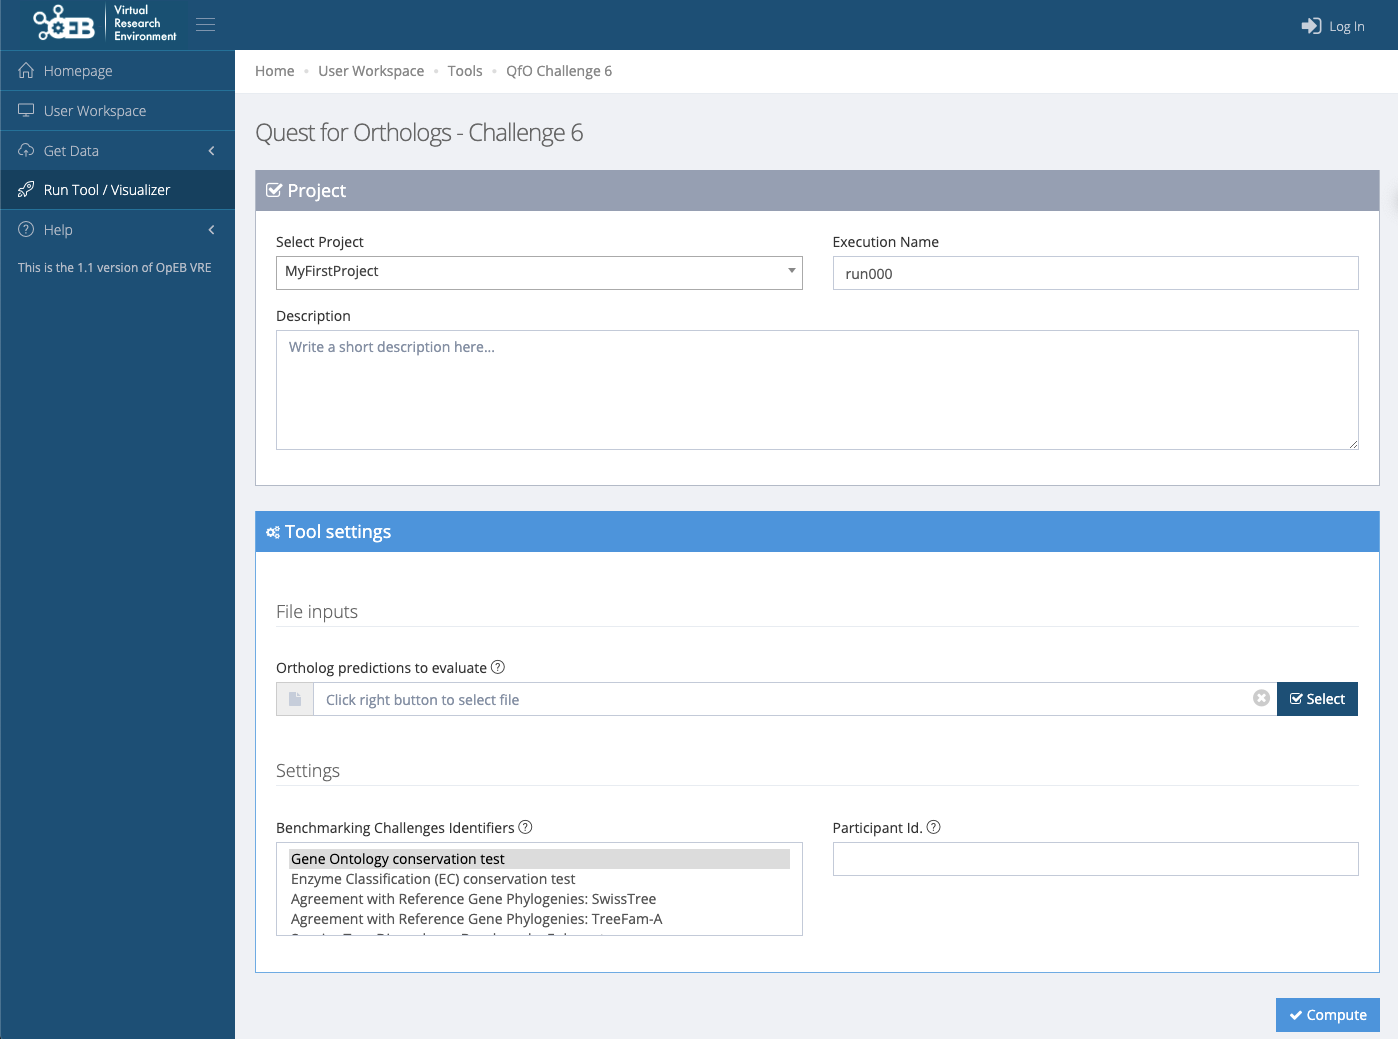
On the OpenEBench page, you are able to upload your orthology predictions. You can either create a user account to save your workspace, or run as a temporary account (limited to 2 Gb and active for one week). If you already have an account, you can select your project; otherwise you can create one.
Upload the ortholog predictions by using the left drop-down menu: Get Data -> Upload Files, and select your files to upload.
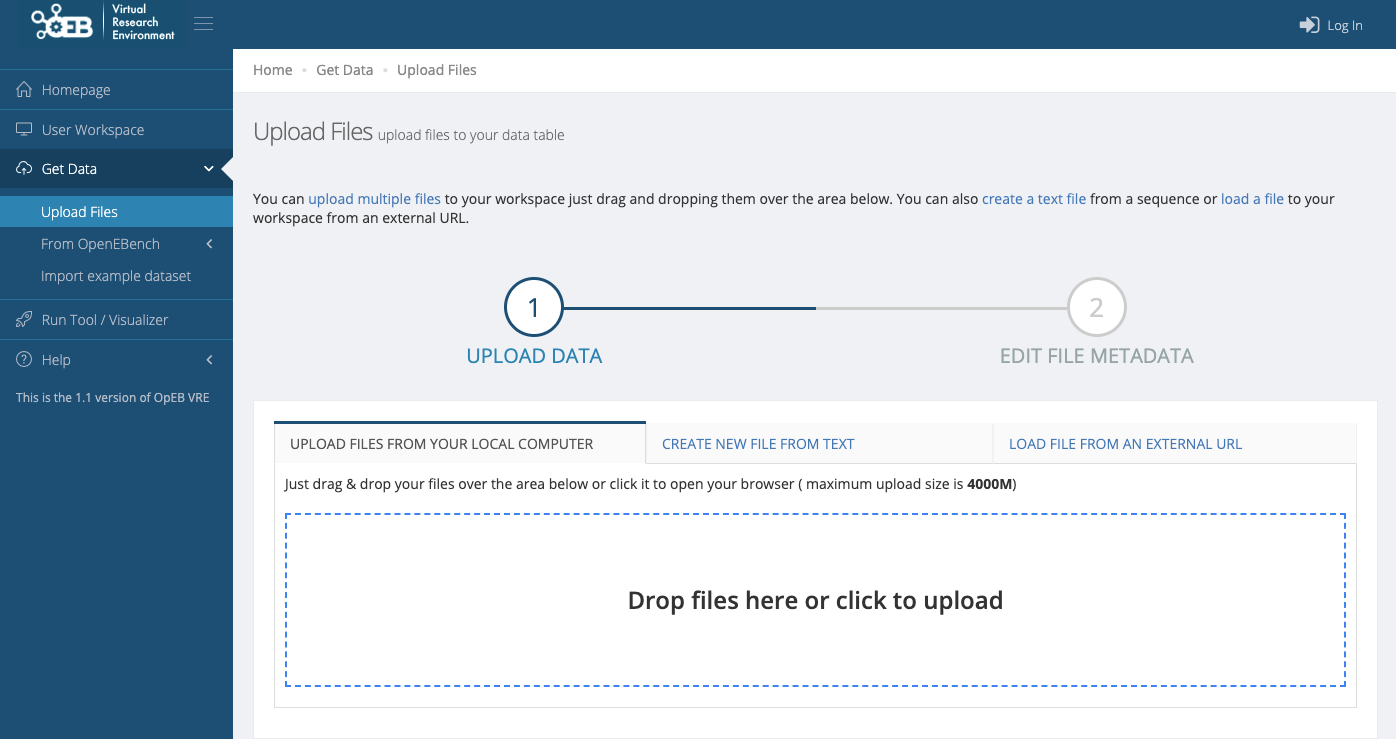
Your ortholog inferences (in one of the acceptable formats, described above) must be loaded into the workspace. This is done by clicking Select, under Tool settings -> File inputs -> Ortholog predictions to evaluate. If this is your first time, you will need to follow the instructions under +Can’t find your data?
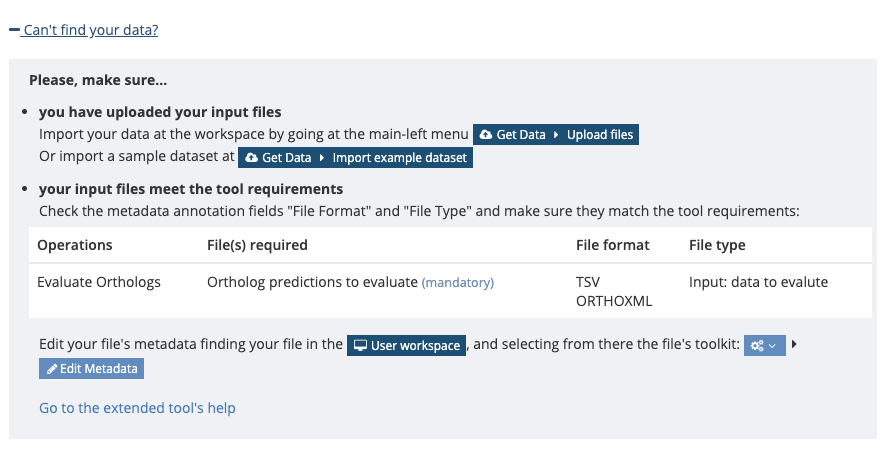
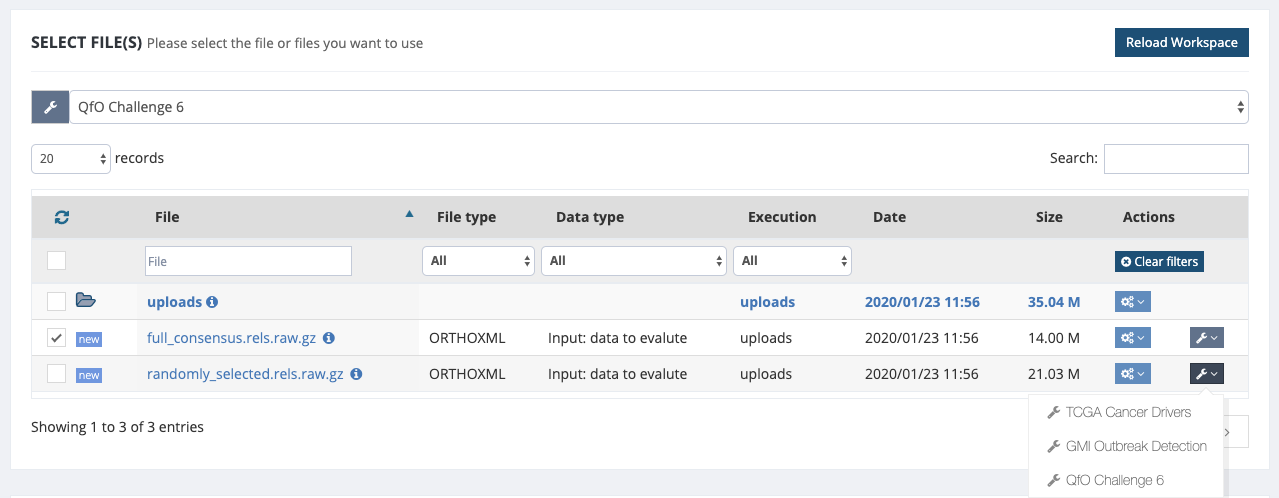
As an example, we import a dataset by choosing Get Data -> Import Example Dataset -> and selecting QfO challenge 6 for the supplied datasets. The data includes the benchmarking metrics computed for two different sets of ortholog pairs:
- full_consensus.rels.raw.gz: 1,895,876 ortholog pairs shared across 14 participants data in the QfO6.
- randomly_selected.rels.raw.gz: 2,801,381 ortholog pairs selected randomly across 14 participants data in the QfO6.
After uploading the data into your workspace, you can select the file (click on the left-hand side box), then select the QFO Challenge 6 from the Action drop-down menu on the right-hand side.
After selecting your orthology data, you can choose which benchmarks to run underneath Settings -> Benchmarking Challenges Identifiers. In this example we run the Gene Ontology conservation test and the Agreement with Reference Gene Phylogenies: SwissTree only.
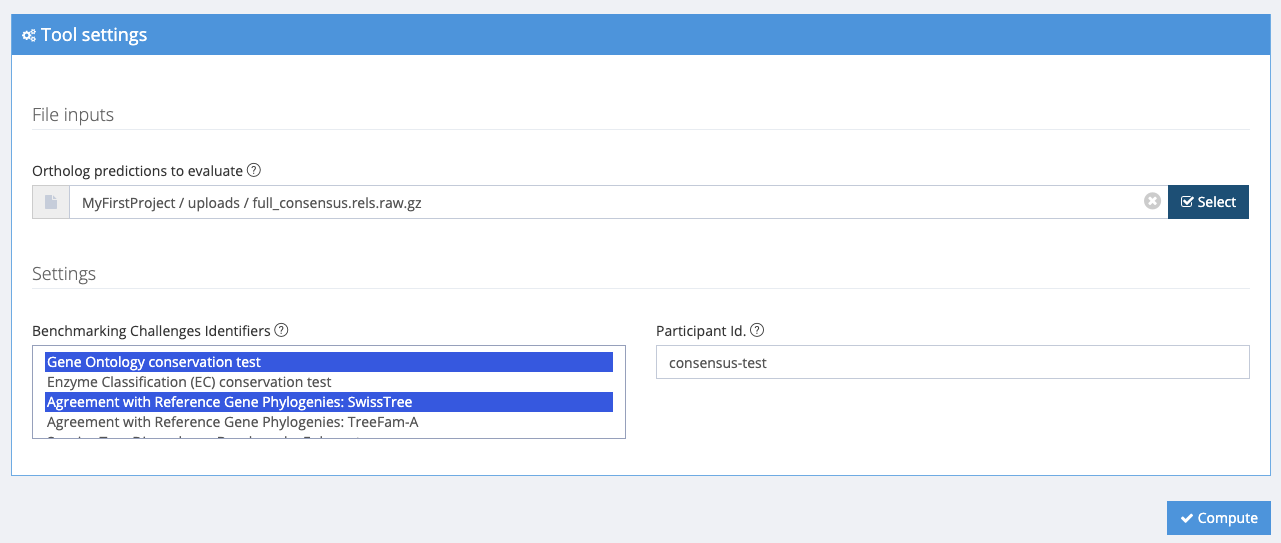
After clicking submit, the job will be sent to the OpenEBench servers for computation. The job can be monitored from the Project Workspace, under Last Jobs.
How do my benchmarking results get officially added to the public results?
In order to make your method a public dataset that other methods will compare with, please write an email to openebench-support@bsc.es and provide your email address and Open E-Bench user name. Communicate which set of your benchmarking results to include in the group results. The method / algorithm itself should be described in a publication and accessible to users.
